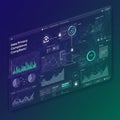
digital financial dashboard displaying real time data analytics and charts |
||||||||||||||||||||||||||||||||||||||||
navigate by keyword : used types trends tracking text suggests specific sleek signage sectors screenshot red realtime presentation points pie person performance orange multiple multimedia modern metrics market line like layout interface indicating including hightech highlight green graphs graph generated games gadget font financial finance environment emphasizing electronics displaying digital diagram design data dashboard dark commonly colors charts bright brand blue bar background arranged |
||||||||||||||||||||||||||||||||||||||||
|
||||||||||||||||||||||||||||||||||||||||
A digital interface displaying various financial data charts and metrics. Multiple graph types, including line graphs, bar charts, and pie charts, are arranged on a dark blue background. Bright colors like green, red, blue, and orange highlight specific data points and trends. The overall layout suggests a real-time analytics dashboard, commonly used in finance or data analysis sectors, emphasizing tracking performance and market trends. The interface is sleek and modern, indicating a high-tech environment. |
||||||||||||||||||||||||||||||||||||||||
Stockphotos.ro (c) 2025. All stock photos are provided by Dreamstime and are copyrighted by their respective owners. |