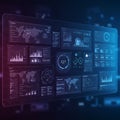
digital dashboard displaying multiple data graphs and charts futuristic interface |
||||||||||||||||||||||||||||||||||||||||
navigate by keyword : visual typical text technological suggests stage signage screenshot scientific realtime purple providing prominent presentation poster panels overview number multiple multimedia monitoring modern line lighting light interspersed interface indicators hightech green graphs glowing gadget futuristic font financial fields feel feature environment enhancing emphasize elements displaying digital design data dashboard darkness dark comprehensive colors circular charts brand blue bar background analytics |
||||||||||||||||||||||||||||||||||||||||
|
||||||||||||||||||||||||||||||||||||||||
Digital dashboard displaying multiple data graphs and charts in a futuristic interface. Various panels feature line and bar graphs, with prominent colors of green and blue on a dark background. Circular charts and indicators are interspersed among the graphs, providing a comprehensive overview of data analytics. The design suggests real-time data monitoring, typical in financial, technological, or scientific fields. The visual aesthetics emphasize a high-tech environment with glowing elements enhancing the modern, digital feel. |
||||||||||||||||||||||||||||||||||||||||
Stockphotos.ro (c) 2025. All stock photos are provided by Dreamstime and are copyrighted by their respective owners. |