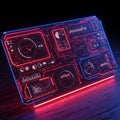
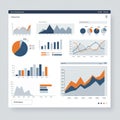
digital dashboard displaying various graphs charts and data visualizations the |
||||||||||||||||||||||||||||||||||||||||
navigate by keyword : visualizations violet values trends trees text tall sunlight statistics spread sleek show shades screenshot readability purple pink pie percentages pathway panels organ numerical number multiple multimedia monitoring modern metrics line layout interface information including illuminating graphs golden gadget forest font focus filters features eye enhancing elements efficiently displaying digital designed design data dashboard dark covered charts brand blue bar background art |
||||||||||||||||||||||||||||||||||||||||
|
||||||||||||||||||||||||||||||||||||||||
Digital dashboard displaying various graphs, charts, and data visualizations. The interface features multiple panels with bar graphs, line graphs, and pie charts, predominantly in shades of purple, pink, and blue. The elements show data trends and statistics across different metrics, including percentages and numerical values. The layout is sleek and modern, designed for monitoring and analyzing information efficiently. The visualizations are spread across a dark background, enhancing readability and focus. |
||||||||||||||||||||||||||||||||||||||||
Stockphotos.ro (c) 2025. All stock photos are provided by Dreamstime and are copyrighted by their respective owners. |