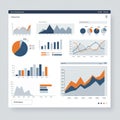
digital dashboard displaying various data visualizations including bar charts line |
||||||||||||||||||||||||||||||||||||||||
navigate by keyword : writing visualizations vibrant trends text suggests sleek signage sign show semitransparent screenshot readability purposes presentation poster pie perspective orange offering number modern metrics lines line likely like layout labels label interface insights including holographic grid graphs gadget font fluctuations financial enhancing document distributions displaying display digital designed design data dashboard dark contrasts colors charts chart business brand blue bar banner background art analysis aigenerated advertising |
||||||||||||||||||||||||||||||||||||||||
|
||||||||||||||||||||||||||||||||||||||||
Digital dashboard displaying various data visualizations, including bar charts, line graphs, and a pie chart. The layout is sleek and modern, with a dark background that contrasts with vibrant colors like orange and blue on the graphs. The interface is designed for data analysis, offering insights into trends and metrics, likely for business or financial purposes. The charts show fluctuations and distributions, with labels and grid lines enhancing readability. The perspective suggests a semi-transparent holographic display. |
||||||||||||||||||||||||||||||||||||||||
Stockphotos.ro (c) 2025. All stock photos are provided by Dreamstime and are copyrighted by their respective owners. |