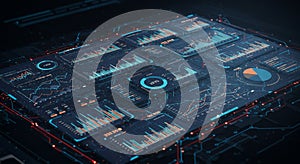
digital dashboard displaying various charts and graphs with technical analysis |
||||||||||||||||||||||||||||||||||||||||
navigate by keyword : use typical trends time theatre technical suggesting statistical stage stadium skyscraper screenshot reporting reds presentation predominant pie performance patterns oranges night metropolis metrics line light lending interface intelligence indicating includes include implies hightech graphs generated futuristic format financial features environments elements displaying digital decisionmaking datadriven data dashboard dark crowd complex colors circuitlike charts business blues blue bar background audience arena analytical analysis aesthetic advanced |
||||||||||||||||||||||||||||||||||||||||
|
||||||||||||||||||||||||||||||||||||||||
Digital dashboard displaying various charts and graphs with technical analysis elements. Features line graphs, bar charts, and pie charts, indicating data trends over time. Predominant colors include blues, reds, and oranges on a dark background, suggesting a high-tech, analytical interface. Includes complex circuit-like patterns, lending an advanced, futuristic aesthetic. The data presentation format implies use in financial analysis, performance metrics, or statistical reporting, typical in business intelligence or data-driven decision-making environments. |
||||||||||||||||||||||||||||||||||||||||
Stockphotos.ro (c) 2025. All stock photos are provided by Dreamstime and are copyrighted by their respective owners. |