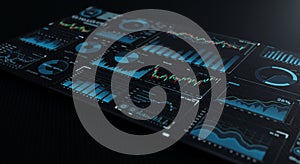
the image showcases digital dashboard displaying various data visualizations

navigate by keyword : visualizations visualization used text technical supports sleek signage showcases screenshot scheme red purposes purple progress presenting presentation poster points pie number multimedia modern look line likely including highlighted green graphs giving generated gadget format font financial electronics displaying digital design data dashboard dark concise complex color clear circular charts business brand blue black bar background analytical analysis advertising

The image showcases a digital dashboard displaying various data visualizations, Royalty Free Stock Photo
Smart Data Visualization in the Age of Digital Transformation Royalty Free Stock Photo
Analyzing Data for Business Insights: A Modern Digital Approach Royalty Free Stock Photo
Touching the Future: Data-Driven Decision Making in Action Royalty Free Stock Photo
Futuristic Digital Dashboard with Data Visualization and Analytics Royalty Free Stock Photo
AI-Generated Business Dashboard Royalty Free Stock Photo
Futuristic Car Dashboard Royalty Free Stock Photo
The image showcases a digital dashboard displaying various data visualizations,
Business Dashboard with Data Visualization Royalty Free Stock Photo
AI-Generated Data Visualization Royalty Free Stock Photo
Advanced Data Visualization on a Tablet Royalty Free Stock Photo
Modern Business Dashboard on Laptop Royalty Free Stock Photo
Cybersecurity Threat Detection Dashboard Display on Monitor with Server Components and Data Visualization Royalty Free Stock Photo
Digital Data Visualization on Tablet Screen with Graphs and Metrics Royalty Free Stock Photo
Data Analysis Dashboard on Computer Monitor Royalty Free Stock Photo
The image showcases a digital dashboard displaying various data visualizations, including bar graphs, pie charts, line graphs, and circular progress charts. The color scheme is predominantly blue and black, giving it a sleek, modern look. The graphs appear on a dark background, with data points highlighted in red, blue, and green. The dashboard is likely used for analytical purposes, presenting complex data in a clear, concise format. This visualization supports financial, business, or technical analysis.


Stockphotos.ro (c) 2025. All stock photos are provided by Dreamstime and are copyrighted by their respective owners.