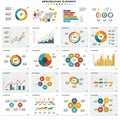
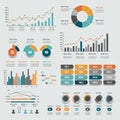
data visualization infographic with various charts and graphs the design includes |
||||||||||||||||||||||||||||||||||||||||
navigate by keyword : world visualization visual timeline text teal spread show screenshot represent progress presentation poster pie percentages pattern palette orange number multimedia map line layout intersperse infographic indicators indicating includes icons hierarchy gray graphs global games gadget font feature enhancing design data dark contrast color clear circular circle charts centered categories cartoon brand bar background art aigenerated advertising |
||||||||||||||||||||||||||||||||||||||||
|
||||||||||||||||||||||||||||||||||||||||
Data visualization infographic with various charts and graphs. The design includes bar graphs, pie charts, and line graphs using a color palette of orange, teal, and dark gray. A world map is centered, indicating global data spread. Circular progress indicators show percentages, while some graphs feature timeline data. Icons intersperse the layout to represent different data categories, enhancing the visual hierarchy on a dark background for clear contrast. |
||||||||||||||||||||||||||||||||||||||||
Stockphotos.ro (c) 2025. All stock photos are provided by Dreamstime and are copyrighted by their respective owners. |