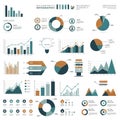
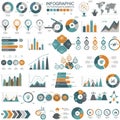
infographic with various data visualization elements including line graphs pie charts |
||||||||||||||||||||||||||||||||||||||||
navigate by keyword : visualization tones text suitable soft sequences sections screenshot scheme reports rectangular presentations presentation present pink pie percentages people pattern pastel organizes number logo line layout label information infographic including includes illustrating icons hierarchically headings green gray graphs font flow enhancing elements drawing document diagram designs design descriptions data comprehension comparisons color circular circle charts cartoon cameras brand bar arrowshaped aigenerated |
||||||||||||||||||||||||||||||||||||||||
|
||||||||||||||||||||||||||||||||||||||||
Infographic with various data visualization elements including line graphs, pie charts, bar graphs, and flow charts. The color scheme includes soft pastel tones of pink, green, and gray. There are circular, rectangular, and arrow-shaped designs, illustrating percentages, sequences, and comparisons. Icons such as cameras and people are present, enhancing data comprehension. The layout organizes information hierarchically, with sections for headings and descriptions, suitable for presentations or reports. |
||||||||||||||||||||||||||||||||||||||||
Stockphotos.ro (c) 2025. All stock photos are provided by Dreamstime and are copyrighted by their respective owners. |