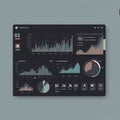
data analysis dashboard with colorful visualizations and metrics |
||||||||||||||||||||||||||||||||||||||||
navigate by keyword : visualizations visualization visual vibrant user trends trend tools tool technology techniques storytelling statistical software representation reporting report presents performance operational numerical modern metrics market layout interface interactive intelligence insights insightful information infographics improved graphics graphical graph financial featuring explore exploration experience engagement elements digital design decisionmaking datadriven data dashboard creative comparison colorful charts charting chart business breakdown analytics analytical analysis |
||||||||||||||||||||||||||||||||||||||||
|
||||||||||||||||||||||||||||||||||||||||
Explore a modern data analysis dashboard featuring vibrant charts and metrics. This visual tool presents insightful analytics for improved decision-making in business |
||||||||||||||||||||||||||||||||||||||||
Stockphotos.ro (c) 2025. All stock photos are provided by Dreamstime and are copyrighted by their respective owners. |