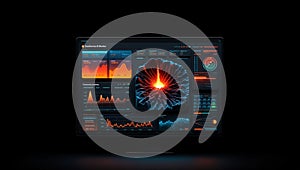
advanced digital dashboard showcasing complex data visualizations and analytics |
||||||||||||||||||||||||||||||||||||||||
navigate by keyword : widgets visualizations visualization tones text technology suggesting sleek signage showcasing show sets screenshot screen representation red presents presentation pie peak number multimedia monitoring modern metrics machine line layout intuitive interface indicating include graphs generative games gadget font focus features electronics efficient displayed digital differing diagram design data dashboard contrasting complex colors colorful clarity charts chart central catering brand blue bar anomaly analytics |
||||||||||||||||||||||||||||||||||||||||
|
||||||||||||||||||||||||||||||||||||||||
A digital dashboard displayed on a screen presents complex data visualizations and analytics. Features include colorful charts, graphs, and a central 3D visualization with red and blue tones, indicating a peak or anomaly. Various widgets show differing data sets, such as bar and line graphs, a pie chart, and metrics in contrasting colors for clarity. The layout is intuitive, catering to data analysis and monitoring. The interface is sleek and modern, suggesting a focus on advanced technology and efficient data representation. ai generative |
||||||||||||||||||||||||||||||||||||||||
Stockphotos.ro (c) 2025. All stock photos are provided by Dreamstime and are copyrighted by their respective owners. |