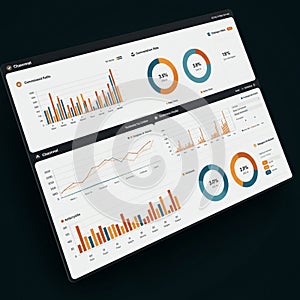
dashboard interface displaying various statistical graphs and charts dark |
||||||||||||||||||||||||||||||||||||||||
navigate by keyword : visualization values user text suggests statistics statistical software signage separate sections screenshot represented rates presentation poster pie pattern organized orange offering numeric multimedia modules metrics logo line like layout labeled label interface includes graphs generated gadget font document displaying diagram design data dashboard dark conversion conversation colors charts channel cartoon business brand blue bar banner background axes application analytics analytical advertising |
||||||||||||||||||||||||||||||||||||||||
|
||||||||||||||||||||||||||||||||||||||||
Dashboard interface displaying various statistical graphs and charts on a dark background. Includes bar graphs, line graphs, and pie charts, primarily using blue and orange colors. Sections are labeled "Channel" and "Conversation" with data represented for metrics like conversion rates and user statistics. The layout is organized into separate modules with labeled axes and numeric values, offering an analytical presentation. The design suggests an application or software for data visualization and business analytics. |
||||||||||||||||||||||||||||||||||||||||
Stockphotos.ro (c) 2025. All stock photos are provided by Dreamstime and are copyrighted by their respective owners. |