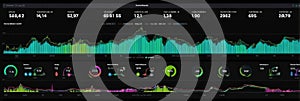
dashboard displaying real time data analytics with various metrics and charts dark interface |
||||||||||||||||||||||||||||||||||||||||
navigate by keyword : dashboard analytics metrics charts graphs visualization trends interface dark theme data analysis performance tracking business intelligence statistics monitoring software technology user experience insights indicators design colorful display information network system engagement efficiency presentation control panel digital graphical interactive tools kpi statistical operational management generated |
||||||||||||||||||||||||||||||||||||||||
|
||||||||||||||||||||||||||||||||||||||||
Real-time analytics dashboard showcasing multiple metrics, charts, and graphs to visualize data trends on a dark interface with colorful elements. AI generated |
||||||||||||||||||||||||||||||||||||||||
Stockphotos.ro (c) 2025. All stock photos are provided by Dreamstime and are copyrighted by their respective owners. |