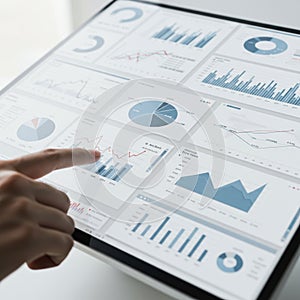
touchscreen interface displaying various business analytics charts and graphs |
||||||||||||||||||||||||||||||||||||||||
navigate by keyword : writing visually use trends touchscreen tones text technology suggesting statistics show setup sets presentation points pie person performance paper money metrics line learning label interpret interface interaction intelligence including implies highlighting hand gray graphs gadget font focus financial document displaying digital design datasets data dashboard currency complex charts cash business brand blue bar art analytics analysis aigenerated advertising |
||||||||||||||||||||||||||||||||||||||||
|
||||||||||||||||||||||||||||||||||||||||
Touchscreen interface displaying various business analytics charts and graphs, including bar charts, line graphs, and pie charts. A hand points at the data, suggesting interaction with the digital dashboard. The graphs, predominantly in blue and gray tones, show different data sets and trends, such as financial statistics or performance metrics. The setup implies a focus on data analysis or business intelligence, highlighting the use of technology to interpret complex datasets visually. |
||||||||||||||||||||||||||||||||||||||||
Stockphotos.ro (c) 2025. All stock photos are provided by Dreamstime and are copyrighted by their respective owners. |