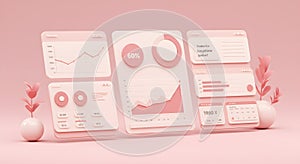
modern business analytics dashboard with charts and graphs pink tones |
||||||||||||||||||||||||||||||||||||||||
| navigate by keyword : dashboard analytics data visualization charts graphs user interface experience digital screen report statistics metrics information intelligence business finance marketing technology software application platform management strategy planning growth trend performance analysis infographic render modern minimalist clean abstract pink pastel soft colors elegant light contemporary creative design graphic background concept futuristic line graph bar chart pie donut numbers percentages text plant vase decorative floating isometric presentation website app corporate startup innovation development cloud computing network |
||||||||||||||||||||||||||||||||||||||||
|
||||||||||||||||||||||||||||||||||||||||
| A clean and modern 3D render showcasing various digital dashboard elements and data visualizations. Floating UI components in soft pink and white tones display line graphs, bar charts, donut charts, and numerical statistics, representing business intelligence and analytics. Small decorative plants in spherical vases add a touch of organic design. This minimalist illustration is ideal for concepts related to financial reporting, marketing insights, technology, data analysis, UI UX design, and corporate presentations, conveying growth, strategy, and digital transformation. |
||||||||||||||||||||||||||||||||||||||||
|
Stockphotos.ro (c) 2025. All stock photos are provided by Dreamstime and are copyrighted by their respective owners. |
||||||||||||||||||||||||||||||||||||||||