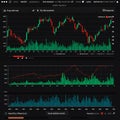
line graph displaying financial stock market data grid background

navigate by keyword : yellow wind wave volume vertical trends transitions trading top time text sunlight suggests suggesting stock specific sky signage screenshot represent red price presentation poster points overall numbers market line light information indicating image illustration horizon grid green graph formations font financial features dynamic displaying diagram design data cloud circle charts changes candlestick brand bottom blue bars background backdrop area appear analysis advertising

Line graph displaying financial or stock market data on a grid background. It Royalty Free Stock Photo
Line and bar graph displaying financial data on a dark grid background. Blue and Royalty Free Stock Photo
A glowing red line graph on a dark background, displaying fluctuating data points Royalty Free Stock Photo
Green financial data line graph on black background displaying market trends Royalty Free Stock Photo
Abstract financial data analysis displaying stock market bar chart and line graph with reflections Royalty Free Stock Photo
Displaying US dollar bill under red fluctuating line graph on data dashboard, with numeric labels Royalty Free Stock Photo
A digital chart displaying a financial graph with fluctuating lines, indicative of stock or Royalty Free Stock Photo
Line graph displaying financial or stock market data on a grid background. It
Green and red candlestick chart displaying financial data trends on a dark grid Royalty Free Stock Photo
Displaying financial data with red line graph plus white cyan area chart against neon blue grid Royalty Free Stock Photo
A graphic interface displaying multiple financial charts with data visualizations. The Royalty Free Stock Photo
Stock market chart displaying candlestick patterns in red and green, indicating price Royalty Free Stock Photo
A financial chart displaying a candlestick pattern, used in stock market analysis. Royalty Free Stock Photo
Financial chart displaying candlestick patterns against a dark grid background. A Royalty Free Stock Photo
Abstract financial graph displaying candlestick charts on a digital grid, representing Royalty Free Stock Photo
Line graph displaying financial or stock market data on a grid background. It features candlestick formations, with red and green bars indicating price changes over time. Vertical yellow bars at the bottom represent trading volume. The chart's backdrop transitions from blue to green, suggesting financial analysis or market trends. Text and numbers appear in the top area, indicating specific data points or trading information. The overall design suggests dynamic financial trends.


Stockphotos.ro (c) 2025. All stock photos are provided by Dreamstime and are copyrighted by their respective owners.