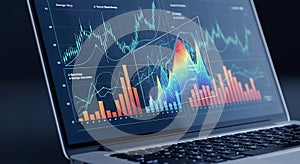
laptop screen displaying complex data visualization with graphs and charts the |
||||||||||||||||||||||||||||||||||||||||
navigate by keyword : vivid visualizations visualization visual view trends text suggests statistical signage screenshot screen scientific representing relate red providing points orange multimedia metrics map lines line likely laptop labeled keyboard interaction information include image heat green graphs gadget foreground font financial features enhancing elements electronics displaying display discrete design data dark continuous comprehensive complex colors colorful charts business brand blue bars bar background axes art analysis |
||||||||||||||||||||||||||||||||||||||||
|
||||||||||||||||||||||||||||||||||||||||
Laptop screen displaying complex data visualization with graphs and charts. The display features line graphs, bar charts, and a colorful heat map, all representing statistical data. The visual elements include axes with labeled metrics, red and orange bars for discrete data points, and green lines for continuous trends. The background is dark, enhancing the vivid colors of the data visualizations. The graphs likely relate to financial, scientific, or business analysis, providing a comprehensive view of the information. The keyboard in the foreground suggests interaction with the data. |
||||||||||||||||||||||||||||||||||||||||
Stockphotos.ro (c) 2025. All stock photos are provided by Dreamstime and are copyrighted by their respective owners. |