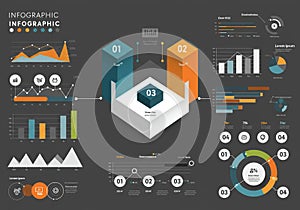
infographic displaying various data visualization elements dark background |
||||||||||||||||||||||||||||||||||||||||
navigate by keyword : white visualization utilized triangular themes text technology structure statistics show shades screenshot represent presenting presentation poster points plan percentages peaks pattern overview orange numerical multimedia metrics map line labeled infographic includes icons gray graphs generated games font elements drawing document distributed displaying diagrams diagram design data dark cube comprehensive colors circular circle charts center cartoon brand blue bars bar background advertising |
||||||||||||||||||||||||||||||||||||||||
|
||||||||||||||||||||||||||||||||||||||||
Infographic displaying various data visualization elements on a dark background. Includes line graphs with triangular peaks, bar charts with blue, orange, and white bars, and a 3D cube structure in the center labeled 01, 02, and 03. Circular diagrams show numerical statistics, and icons represent technology themes. Colors utilized predominantly are blue, orange, and shades of gray. Percentages and data points are distributed throughout, presenting a comprehensive overview of related metrics. |
||||||||||||||||||||||||||||||||||||||||
Stockphotos.ro (c) 2025. All stock photos are provided by Dreamstime and are copyrighted by their respective owners. |