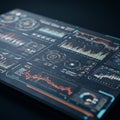
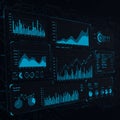
high tech digital dashboard with multiple data visualizations including line graphs |
||||||||||||||||||||||||||||||||||||||||
navigate by keyword : visualizations view trends transparent text suggests sleek signage sign screenshot screen purposes presentation poster percentages organized operational numbers number multiple multimedia metrics logo line light layout labels interface including includes hues hightech graphs gadget futuristic font focus environment elements displayed digital diagram detailed design decisionmaking data dashboard dark comprehensive circular charts category brand blue bar analytics analysis allowing |
||||||||||||||||||||||||||||||||||||||||
|
||||||||||||||||||||||||||||||||||||||||
High-tech digital dashboard with multiple data visualizations, including line graphs, bar charts, and circular graphs. Displayed on a sleek, transparent screen in a dark environment, elements are primarily in blue hues. The interface includes numbers, percentages, and category labels for detailed analytics. This futuristic design suggests a focus on data analysis, possibly for operational or decision-making purposes. The layout is organized, allowing for a comprehensive view of various data metrics and trends. |
||||||||||||||||||||||||||||||||||||||||
Stockphotos.ro (c) 2025. All stock photos are provided by Dreamstime and are copyrighted by their respective owners. |