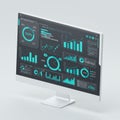
futuristic digital interface displays various analytical graphs and charts shades

navigate by keyword : world visualizations virtual trends time technological stage sleek signage show shades screenshot progress present pink performance organized offering musician music multimedia monitoring metrics map line light layout interface indicators indicating included graphs global generated gadget futuristic font environment entertainment electronics displays digital designed data concert complex circular charts brand blue black bar background analytical analysis aesthetic advertising advanced

A futuristic digital interface displays various analytical graphs and charts in shades of Royalty Free Stock Photo
A transparent digital interface displays various analytical graphs and charts, including Royalty Free Stock Photo
A futuristic digital interface floating above a textured surface displays various Royalty Free Stock Photo
A digital interface displays various analytical graphics against a dark backdrop. Bar Royalty Free Stock Photo
A computer monitor displays a digital dashboard interface with various data Royalty Free Stock Photo
   
   
A futuristic digital interface displays various analytical graphs and charts in shades of
A sleek, futuristic digital dashboard displays various data visualizations. Features Royalty Free Stock Photo
A digital dashboard displays various data visualizations, including bar graphs, pie Royalty Free Stock Photo
   
High-tech dashboard with financial and analytical data visualizations in a dark modern setting Royalty Free Stock Photo
Abstract data visualization with a futuristic interface featuring multiple charts and Royalty Free Stock Photo
A sleek, modern monitor displays a high-tech interface with colorful charts and Royalty Free Stock Photo
Digital interface displays various floating graphics on a dark background, featuring Royalty Free Stock Photo
A futuristic digital interface displays various analytical graphs and charts in shades of pink and blue on a black background. Circular progress indicators and bar graphs present complex data visualizations. A world map is included, possibly indicating global metrics, while line charts show trends over time. The layout is sleek and organized, designed for data analysis or monitoring in a virtual or digital environment, offering an advanced, technological aesthetic.


Stockphotos.ro (c) 2025. All stock photos are provided by Dreamstime and are copyrighted by their respective owners.