futuristic digital interface displaying multiple data visualizations including bar charts |
||||||||||||||||||||||||||||||||||||||||
navigate by keyword : visualizations used tracking text stage stadium signage shows setting semitransparent screenshot scheme represent presentation poster pie performance orange office night multiple metrics line light layout interface intelligence industrial indistinct including holographic hightech grid graphs graphics graph giving futuristic font effect displaying digital design data darkness creating color charts chart business brand blue bar background art arranged appears analytic ambiance aigenerated |
||||||||||||||||||||||||||||||||||||||||
|
||||||||||||||||||||||||||||||||||||||||
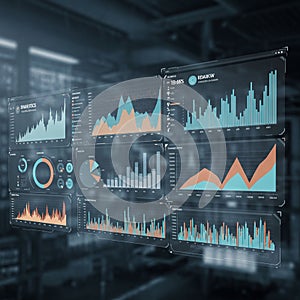
Futuristic digital interface displaying multiple data visualizations, including bar charts, line graphs, and pie charts. The graphics are arranged in a grid layout with a blue and orange color scheme. The background shows an indistinct industrial or office setting, giving a high-tech, analytic ambiance. Each chart and graph appears to represent different data metrics, possibly used for business intelligence or performance tracking. The interface is semi-transparent, creating a holographic effect. |
||||||||||||||||||||||||||||||||||||||||
Stockphotos.ro (c) 2025. All stock photos are provided by Dreamstime and are copyrighted by their respective owners. |