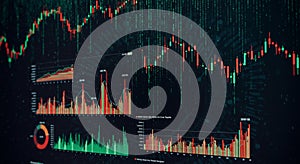
digital interface displaying complex financial data with multiple graphs and charts |
||||||||||||||||||||||||||||||||||||||||
navigate by keyword : visible trends theme text technical suggests stage specific software smaller skyscraper skyline signage showing screenshot resembling red presentation poster numeric night multiple monitoring metropolis metrics matrixlike market main lines line light interface indepth green graphs generated font financial features faintly enhancing displaying display digital data darkness dark complex colorcoded charts candlestick brand binary bars bar background backdrop appearance analytical analysis advertising |
||||||||||||||||||||||||||||||||||||||||
|
||||||||||||||||||||||||||||||||||||||||
A digital interface displaying complex financial data with multiple graphs and charts. The main background features candlestick charts showing stock market trends in green and red against a dark backdrop, resembling financial market analysis software. Various smaller graphs and bar charts display specific data metrics with color-coded lines and bars. Binary or matrix-like numeric data is faintly visible, enhancing the technical and analytical appearance. The overall theme suggests in-depth financial analysis and market monitoring. |
||||||||||||||||||||||||||||||||||||||||
Stockphotos.ro (c) 2025. All stock photos are provided by Dreamstime and are copyrighted by their respective owners. |