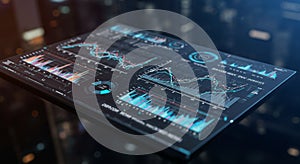
digital display screen features sleek futuristic interface with multiple charts and

navigate by keyword : visual urban transparent technology techcentric suggests sleek signage screenshot screen reveals representing red quantitative points palette number multiple multimedia metrics machine line light interface interactive information indicating include implying graphs generated gadget futuristic font focus fluctuating financial features environment emits elements electronics display digital design data darkness cool color cityscape charts brand blurred blue black bar background analytics analysis aidriven advanced

A digital display screen features a sleek, futuristic interface with multiple charts and Royalty Free Stock Photo
Digital display displaying multiple analytic charts and graphs. The interface features Royalty Free Stock Photo
Futuristic transparent display with digital analytics interface. Features multiple graph Royalty Free Stock Photo
A digital wall display features multiple screens with data visualizations, charts, Royalty Free Stock Photo
Futuristic digital dashboard displaying complex financial data and growth charts with futuristic interface Royalty Free Stock Photo
Abstract Digital Data Visualization Dashboard Royalty Free Stock Photo
Futuristic Global Monitoring Control Center with Advanced Technology Displays Royalty Free Stock Photo
A digital display screen features a sleek, futuristic interface with multiple charts and
Digital financial analytics displayed on multiple screens with graphs and data charts Royalty Free Stock Photo
Futuristic UI UX Design on Digital Devices Royalty Free Stock Photo
Futuristic Cybersecurity and Data Analytics Dashboard Royalty Free Stock Photo
Futuristic Financial Data on Transparent Display Royalty Free Stock Photo
Futuristic Data Analysis Interface Royalty Free Stock Photo
Futuristic Data Visualization Interface Royalty Free Stock Photo
Futuristic Control Room with Advanced Digital Interfaces Royalty Free Stock Photo
A digital display screen features a sleek, futuristic interface with multiple charts and graphs. The visual elements include line graphs with fluctuating data points and bar graphs representing quantitative information. The screen emits a cool blue and red color palette, indicating a focus on data analysis or financial metrics. Transparent and interactive, the interface suggests advanced technology or AI-driven analytics. The background reveals a blurred cityscape, implying an urban, tech-centric environment.


Stockphotos.ro (c) 2025. All stock photos are provided by Dreamstime and are copyrighted by their respective owners.