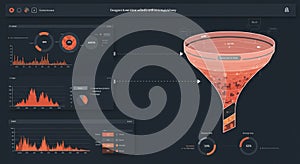
digital dashboard interface dark background displays several data visualization |
||||||||||||||||||||||||||||||||||||||||
navigate by keyword : visualization use tracking tool text suggests statistical stages software shades segments screenshot right represents red presentation present poster pie performance percentages orange multimedia metrics logo line lighting left labeled interface intelligence information graphs generated games gadget funnel font flow enabling emphasis elements document displays digital diagram design data dashboard dark conversion circular circle charts chart cartoon business brand bar background analytical |
||||||||||||||||||||||||||||||||||||||||
|
||||||||||||||||||||||||||||||||||||||||
A digital dashboard interface on a dark background displays several data visualization elements. On the left, circular graphs, pie charts, and bar charts present statistical information. To the right, a funnel chart represents data flow through different stages, with segments labeled by conversion percentages. The charts predominantly use shades of orange and red for emphasis. The interface suggests analytical software or a business intelligence tool, enabling data tracking and performance metrics visualization. |
||||||||||||||||||||||||||||||||||||||||
Stockphotos.ro (c) 2025. All stock photos are provided by Dreamstime and are copyrighted by their respective owners. |