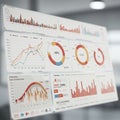
digital dashboard displaying various business analytics featuring line graphs bar |
||||||||||||||||||||||||||||||||||||||||
navigate by keyword : writing visualizations vehicle text suggests statistics sleek signage sign show shades setting sections screen revenue red readability professional presented presentation poster pie person organized orange modern metrics line layout label interior graphs gadget font focus featuring expenses environment enhancing easy document displaying digital design data dashboard customer clothing charts business brand blurred blue bar banner background art analytics aigenerated advertising |
||||||||||||||||||||||||||||||||||||||||
|
||||||||||||||||||||||||||||||||||||||||
A digital dashboard displaying various business analytics, featuring line graphs, bar charts, and pie charts in shades of red, orange, and blue. The data visualizations show metrics such as revenue, expenses, and customer statistics. The layout is modern and sleek, with sections organized clearly for easy readability. The background suggests a professional environment with a blurred interior setting, enhancing the focus on the data presented on the screen. |
||||||||||||||||||||||||||||||||||||||||
Stockphotos.ro (c) 2025. All stock photos are provided by Dreamstime and are copyrighted by their respective owners. |