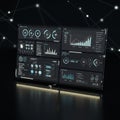
data visualization dashboard with multiple charts and graphs digital interface |
||||||||||||||||||||||||||||||||||||||||
navigate by keyword : white visualization varying used trends theme text techoriented suggests stage signage showing sets set screenshot reporting purple presentation poster pie percentages number night multiple modern minimal line light labels interface includes graphs generated futuristic font focusing financial display digital design data dashboard darkness dark creating configurations colors charts business brand blue bar background analytics analytical aesthetic advertising |
||||||||||||||||||||||||||||||||||||||||
|
||||||||||||||||||||||||||||||||||||||||
Data visualization dashboard with multiple charts and graphs in a digital interface. The display includes bar graphs, line charts, and pie charts in varying configurations, showing different data sets. Colors are predominantly blue and white, set against a dark background, creating a modern and tech-oriented aesthetic. Text labels are minimal, focusing on percentages and data trends. The design suggests an analytical and futuristic theme, possibly used for business analytics or financial reporting. |
||||||||||||||||||||||||||||||||||||||||
Stockphotos.ro (c) 2025. All stock photos are provided by Dreamstime and are copyrighted by their respective owners. |