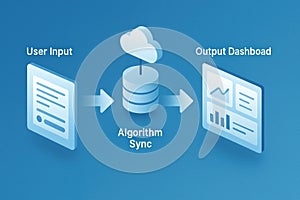
data processing illustration with user input algorithm sync and output dashboard |
||||||||||||||||||||||||||||||||||||||||
navigate by keyword : user sync processing output input data dashboard algorithm flow visualization cloud computing database icon charts graphs transformation analytics digital modern design information analysis workflow process diagram big science technology concept organized layout business intelligence system architecture innovation blue gradient background storage management infographic style pipeline |
||||||||||||||||||||||||||||||||||||||||
|
||||||||||||||||||||||||||||||||||||||||
Illustration shows data processing flow with three main elements on a blue background. On the left, a document icon represents "User Input." In the center, a cloud and database symbolize "Algorithm Sync," emphasizing data processing and storage. On the right, a dashboard with graphs and charts signifies the "Output Dashboard," indicating data visualization. Arrows connect these components, illustrating the progression from input to processing to output. The design uses a 3D style and shades of blue for a modern, technological look. |
||||||||||||||||||||||||||||||||||||||||
Stockphotos.ro (c) 2025. All stock photos are provided by Dreamstime and are copyrighted by their respective owners. |