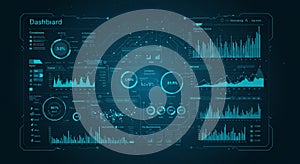
dashboard interface with digital analytics and data visualization elements graphs pie |
||||||||||||||||||||||||||||||||||||||||
navigate by keyword : visualization types trends time text system statistics sleek signage show sections screenshot scheme realtime presentation poster pie percentages organized number multimedia monitoring metrics management lines line light layout interface indicate ideal hightech graphs generated gadget futuristic font featuring enhancing elements display digital dials diagram design data dashboard darkness dark connect color circular circuitlike circle charts brand blue bar analytics analysis aesthetic advertising accents |
||||||||||||||||||||||||||||||||||||||||
|
||||||||||||||||||||||||||||||||||||||||
Dashboard interface with digital analytics and data visualization elements. Graphs, pie charts, and line graphs display various metrics and statistics. Circular dials indicate percentages, while bar charts show data trends over time. The layout is organized into sections, each featuring different data types, all with a sleek, futuristic design in a dark color scheme with blue accents. Circuit-like lines connect elements, enhancing the high-tech aesthetic. Ideal for monitoring, data analysis, and real-time system management. |
||||||||||||||||||||||||||||||||||||||||
Stockphotos.ro (c) 2025. All stock photos are provided by Dreamstime and are copyrighted by their respective owners. |