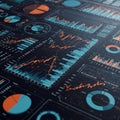
dashboard featuring multiple financial charts and graphs digital display

navigate by keyword : trends text technologically stage signage screenshot scheme reflects red purple prices presentation poster pie numerical multiple multimedia modern metrics market lines line labels indicating include graphs giving generated gadget font fluctuating financial featuring environment elements electronics display digital design depicting data dashboard dark color charts chart brand blue bar banner background art appearance analysis advertising advanced

Dashboard featuring multiple financial charts and graphs on a digital display. Royalty Free Stock Photo
Digital dashboard featuring multiple data visualizations. Charts and graphs display Royalty Free Stock Photo
A digital dashboard featuring multiple data visualization charts and graphs. The Royalty Free Stock Photo
Futuristic digital interface display featuring multiple charts, graphs, and data Royalty Free Stock Photo
Digital dashboard featuring a holographic interface with multiple graphs and charts. A Royalty Free Stock Photo
A digital display featuring various data visualizations against a dark background. It Royalty Free Stock Photo
Futuristic digital dashboard interface featuring multiple data visualization elements, Royalty Free Stock Photo
Dashboard featuring multiple financial charts and graphs on a digital display.
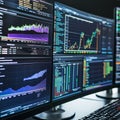
Multiple stock market graphs on a digital display, featuring candlestick charts and line Royalty Free Stock Photo
Digital dashboard featuring multiple data visualizations. Includes line graphs, bar Royalty Free Stock Photo
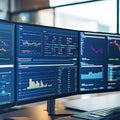
A digital dashboard with graphs, charts, and KPIs displayed on multiple monitors. Royalty Free Stock Photo
Digital dashboard layout featuring data analytics graphics. Multiple interfaces display Royalty Free Stock Photo
Dashboard featuring multiple financial charts and graphs on a digital display. Contains bar charts, line graphs, and a pie chart, depicting various market data trends. Predominantly blue and red color scheme on a dark background, giving a modern and technologically advanced appearance. Elements include fluctuating lines indicating stock prices or other financial metrics, with numerical data and labels. Reflects a stock market or data analysis environment.


Stockphotos.ro (c) 2025. All stock photos are provided by Dreamstime and are copyrighted by their respective owners.