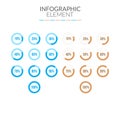
circle percentage pie chart diagrams infographic from 100 elements web design user interface |
||||||||||||||||||||||||||||||||||||||||
navigate by keyword : brand presentation circle logo document cartoon screenshot advertising drawing label design multimedia percentage pie chart diagrams infographic elements web user interface vector business isolated finance graphic graph flat speed bar set information element process circular download loader animation progress gauge statistic meter percent arc symbol indicator score plan count violet loading report purple charts infographics black white gradient blue illustratio icon template cyan dashboard info magenta hot pink round |
||||||||||||||||||||||||||||||||||||||||
|
||||||||||||||||||||||||||||||||||||||||
Set of percentage pie charts for infographics, pie charts from 10 to 100 Web design user interface (UI) or infographics Blue gradient indicator Vector illustration |
||||||||||||||||||||||||||||||||||||||||
Stockphotos.ro (c) 2025. All stock photos are provided by Dreamstime and are copyrighted by their respective owners. |