abstract data visualization features combination bar and line graphs dark |
||||||||||||||||||||||||||||||||||||||||
navigate by keyword : weave visualization vertical trends top theme text technology symbol sides side settings sections screenshot scales sample represent presentation poster pink orange numeric number neon multimedia measurement logo lines line like indices indicating icons highlight grid graphs graph glowing gadget futuristic functions font focus features email drawing dotted document digital diagram design data dark combination circular circle centered cartoon |
||||||||||||||||||||||||||||||||||||||||
|
||||||||||||||||||||||||||||||||||||||||
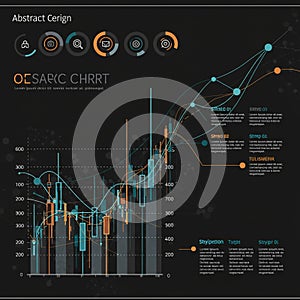
Abstract data visualization features a combination of bar and line graphs on a dark background. Blue and orange lines weave through vertical bars, indicating data trends. Circular icons at the top represent different functions like settings, camera, and email. Side annotations highlight sections of the graph with sample text. Dotted grid lines and numeric indices on the sides suggest scales for measurement. The overall design has a futuristic theme with a focus on analytics and digital technology. |
||||||||||||||||||||||||||||||||||||||||
Stockphotos.ro (c) 2025. All stock photos are provided by Dreamstime and are copyrighted by their respective owners. |